https://justice4allthu.substack.com/p/data-on-the-quiet-surge-in-massachusetts

Justice 4 All
Collection of articles and materials used for Justice 4 All Thursdays.
By Todd Palmer
· Launched a year agoSubscribe
By subscribing, you agree Substack’s Terms of Use, and acknowledge its Information Collection Notice and Privacy Policy.https://substack.com/session-attribution-frame


Discover more from Justice 4 All
Collection of articles and materials used for Justice 4 All Thursdays.
By subscribing, you agree Substack’s Terms of Use, and acknowledge its Information Collection Notice and Privacy Policy.
Already have an account? Sign in
Data on the ‘Quiet Surge’ in Massachusetts
Analysis of New Release from the Deportation Data Project on 8/21/26
AUG 30, 2026
Massachusetts Arrests by City/Town
For the first time, the arrest data has been tagged with the city or town where the arrest happened. I decided to focus on data during Trump 2.0.
- > 9,783 total arrests have occurred in MA from 1/20/2025 thru 8/6/2026
- > 9,261 of those were tagged with a city/town (~95%)https://datawrapper.dwcdn.net/uRh40/1/
Within the hot spots are some that are expected (Milford with 374, Framingham with 323, Lowell with 310) and some that are not – notably Burlington with 951. The immigrant population of Burlington is estimated at 18% as compared to Framingham’s 33% or Milford’s 32%. The population of Burlington (26,377) is also smaller than Milford (30,379) or Framingham (72,362) – so why so many arrests?
Thanks for reading Justice 4 All! Subscribe for free to receive new posts and support my work.Subscribe
The answer is clear – arrests at the ICE Field Office and ISAP location in Burlington.
Rate of Arrests in 2026
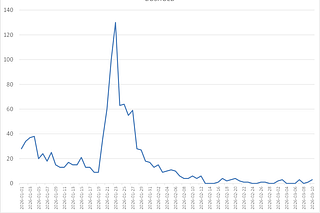
Starting in June, the protest groups in Burlington started seeing more activity; longer lines for check-in appointments, more reports of people detained. Summarizing the arrest data by week, there was a sharp jump at the beginning of June and continuing into July with the highest week for the year (160) occurring in the last week of July.
Including the data from 2025, you can see how the current situation compares to the huge spike in arrests for Patriot 1.0 in May 2025 and Patriot 2.0 in Sep 2025. Aside from those surge periods, the last week of July is the highest arrest total.
Looking at whether the people arrested had a criminal conviction or not reveals the fiction of the “worst of the worst” argument. A field called ‘conviction’ is supplied which has 4 options: Violent Crime, Nonviolent, None, or Blank. I refuse to assume someone has convictions if ICE is too lazy to fill out the field, so I am going to assume that those are additional folks with no convictions.
For 2024, 11% of the people arrested had convictions for violent crimes and 25% had convictions for nonviolent crimes. In 2026, those numbers have fallen to 2.6% convicted of violent crimes and 11% for nonviolent crimes.
Looking at the flip side, people with no convictions noted (none + blank) rose from 63% (50+13) in 2024 to 87% (80+7) in 2026.
Just 13.6% of people arrested in 2026 have any prior convictions.
Population Data
Populations in the Boston Hold Room have peaked previously in Operation Patriot in May 2025 and after Operation Catch-of-the-Day in January 2026.
Since that time, congressional visits have generally found overcrowding not to be a problem, which is supported by the data. Since the January spike the overnight population has been no higher than 34 on June 28.
The horrific overcrowding in Patriot and Catch-of-the-Day was a major problem. But remember that this is a Hold Room and the legal limit for Hold Rooms is 12 hours.
Far from supporting “everything is OK”, the data in fact shows that violations of the 12-hour limit continue.
To highlight this issue, I included data from all of 2024. Since these are populations at midnight, we’d expect to find the facility empty most of the time – which is exactly what the data for 2024 shows. Counting the number of times that the facility is found empty at midnight by year and we get:
2024: 350 out of 365 (96%)
2025: 85 out of 365 (23%)
2026: 33 out of 217 (15%)
We have gone from a facility empty at midnight 96% of the time to one that has people detained 85% of the time.
Populations at the other New England Detention Centers
Checking the trends at the other main detention sites in New England, it appears things have not significantly changed since March. The Plymouth County Correctional Facility continues to maintain the largest population for ICE in New England while the Strafford County Dept of Corrections, FCI Berlin and the Wyatt Detention Facility continue to hold about 100 people each.
The population at FCI Berlin had been declining through March and has since levelled-off near 100.
Length of Stays in Burlington
The new dataset from the Deportation Data Project allows more visibility than previous datasets. In my previous analysis of length-of-stay in Burlington, I noted: it’s pretty complicated because people get transferred to other facilities, so I restricted it to people that had been held in Burlington and then released without being transferred to another facility.
The new dataset includes “stint” data where I can see how long people were in Burlington regardless of what happens to them after that – release, transfer, or deportation.
To check my analysis, I will start by comparing what I see vs. what ICE reported to Ed Markey on 5/6/26 in response to his letter after his visit in December 2025. The table below was sent in that letter.

They gave that breakdown for the date range 1/1/2025 to 4/13/2026. The table below shows what I get for these categories from the Deportation Data Project (DDP) Stints data. In every category, I get fewer cases. To get my numbers, I looked only at individuals who had been Booked Out as well. The ICE personnel may have included people still detained. Another possibility is that the DDP did some elimination of suspected duplicates.

I know that Maria Rosales, a woman from Colombia, was at the facility from 7/10 to 7/20/26. She is easily found, as shown below. The final column is my calculation for the length of her stay.

With that check on my methods, I ran a similar analysis on the length of stays at Burlington going all the way back to 2024 with more categories – which I had to extend out to 16 weeks to include the worst case.


For 2024, 75% of stays in Burlington were under the 12 hour limit. That dropped to 55% in 2025 and has recovered to 85% in 2026. In general, the violations are down compared to 2025, but there were still:
- 629 violations of the 12-hour limit
- 398 stays of 24 hours
- 235 stays of 48 hours
- 163 stays of 72 hours
- 41 stays of longer than a week.
For people booked out of Burlington in 2026, here are the 41 detentions of longer than a week and what happened to them. 19 were bonded out, paroled, or ordered released. 20 were transferred (8 of these were later deported), and 2 were deported directly from Burlington.
Note that we have already had 4,256 book outs from Burlington through July – that is 79% of the 2025 total in just 7 months. That would project out to 7,296 for 2026.

Conclusions
- Arrest data shows that we are at an all-time high (outside of surges) for arrests by week at the end of July.
- The number of people arrested with no criminal convictions continues to rise – now 87% of those arrested in 2026.
- The overcrowding situation has not occurred since late January; however, we still regularly have people detained there are midnight – which was a rarity until Trump 2.0.
- Violations of the 12-hour rule continue to occur – the analysis shows 629 violations in the first 7 months of 2026. Data from 2024 shows that these violations were once much less commonplace.
- Members of Congress attempting to conduct oversight need to adapt to this new reality. ICE is moving most people through the system more quickly, but egregious violations are clearly present in their data. Such violations are just not acceptable. The Constitution does not allow for exceptions.
Thanks for reading Justice 4 All! Subscribe for free to receive new posts and support my work.Subscribe
Discussion about this post
Thanks for doing this work. Reading through I felt a little confused about “charges” vs “convictions”. Did you switch between them deliberately? In the court accompaniments I do there’s quite a difference visible. Lots of charges, very few convictions.
Also worth noting that lots of those charges are for immigration violation – entry without “inspection” as it’s called, overstaying a visa, etc. The respondent will almost always concede those charges as that’s necessary to move forward with other matters such as bond and asylum applications. I wonder if the data actually distinguish these things.
Thank you for this rigorous analysis and for your extreme dedication to unearthing the data.
J4A Week26: Eva and Djeniffer from Cape Verde
ICE is Still Locking Up Pregnant Women
MAR 5•TODD PALMER
3
Analysis of Data on Burlington (BOSHOLD)
with data from the Deportation Data Project
APR 14•TODD PALMER
9
5
1
J4A Week36: The Story of Sonny
MAY 15•TODD PALMER
9
1
4

Ready for more?
Subscribe
© 2026 Todd Palmer · Privacy ∙ Terms ∙ Collection notice
Start your SubstackGet the app
Substack is the home for great culture
Leave a Reply